Using Shot Location Data to Improve Accuracy
Telling a player to "shoot better" isn't coaching. But telling them they convert 70% from the left side and only 30% from the right—that's actionable. Shot location data transforms vague observations into specific training targets.
What Shot Location Data Reveals
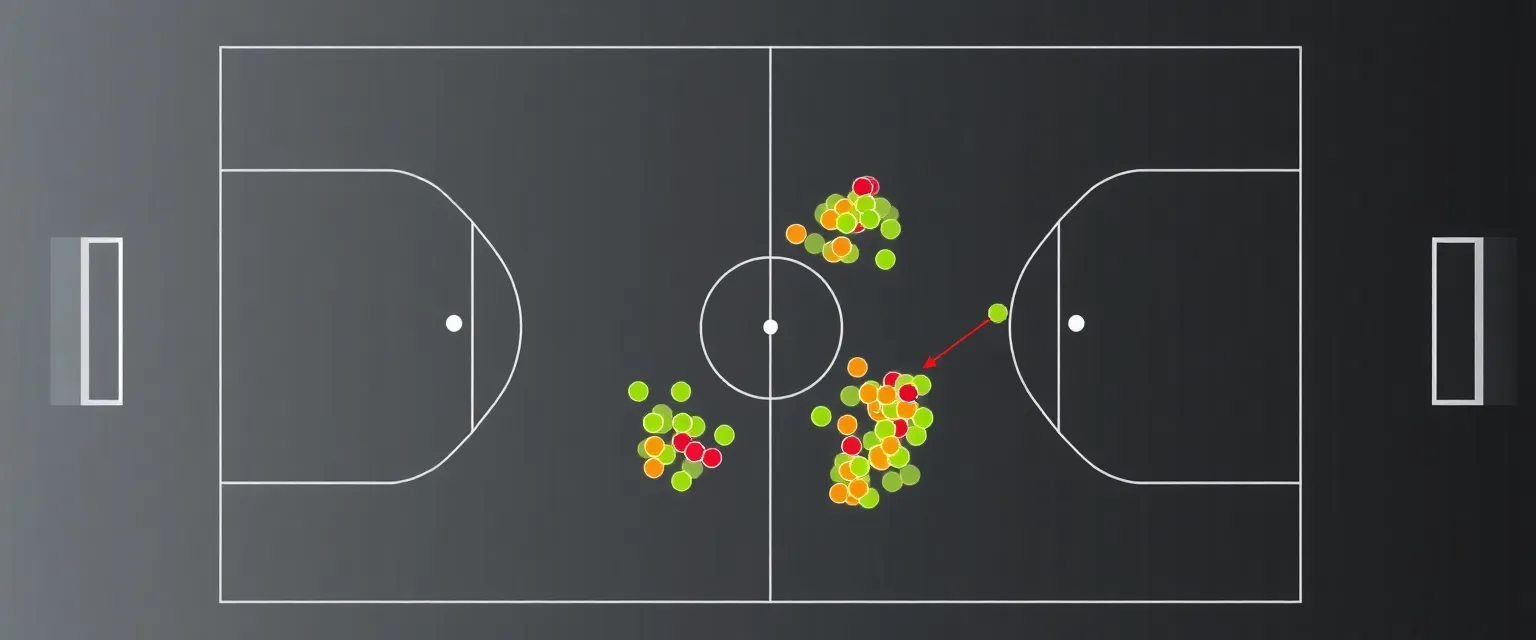
When you track where shots are taken on the court and whether they score, patterns emerge:
- Player tendencies: Some players drift to their strong side. Others only shoot from certain positions.
- Team patterns: Maybe your offense generates lots of shots from the pivot but few from the wings.
- Conversion rates: Different positions have different expected scoring rates. Are yours above or below average?
- Weak spots: If everyone struggles from a certain area, that's a team issue. If one player struggles, that's individual.
Expected Conversion by Position
Not all shots are equal. Generally, conversion rates follow this pattern:
| Position | Expected Rate |
|---|---|
| Fast break (1v1) | 70-80% |
| Pivot/6m shots | 65-75% |
| 7m penalty | 75-85% |
| Wing (good angle) | 50-60% |
| Back court (9m) | 45-55% |
| Wing (tight angle) | 30-40% |
If your wing player is converting 55% on good angles, they're doing well. If your back court players are at 35%, there's room to improve.
Individual Player Analysis
Here's a practical example. After tracking 10 matches, you might see:
- Player #7: 45 shots from the left back position, 28 goals (62%). 12 shots from right back, 3 goals (25%).
This player is clearly more effective from the left. Now you have options:
- Design plays that get them shooting from their strong side
- Work on their weak side in training
- Understand they should pass, not shoot, when on the right
Team-Wide Insights
Aggregate the data across all players and you see your team's tendencies. Maybe you discover that:
- 60% of your shots come from outside 9m, but conversion there is only 35%
- Your pivot only gets 5 shots per match despite converting at 70%
- Your wings are taking shots from impossible angles instead of passing
Each of these is an offensive adjustment waiting to happen. Get the ball to the pivot more. Improve wing decision-making. Work on back court finishing.
Training Applications
Data without action is useless. Here's how to use shot location data in training:
For Individual Players
- Identify their worst zone and create drills that focus on it
- Track improvement over time—are they getting better?
- Set specific targets: "Increase right-side conversion from 25% to 40%"
For the Team
- Adjust play design to create more shots from high-conversion zones
- Practice under-utilized positions (if you never shoot from pivot, why not?)
- Work on shot selection—sometimes not shooting is the right choice
How to Track This
You need two things for each shot:
- Location: Where on the court was the shooter?
- Outcome: Goal, saved, or missed?
Paper tracking works but is tedious to compile. Apps with a court diagram make this much easier—tap where the shot happened, tap the result, done. After a few matches, you'll have enough data to see patterns.
Getting Started
You don't need 100 matches of data to gain insights. Track 3-5 games and look for obvious patterns. Which players shoot from where? Who converts well? Where do goals not come from? Even basic patterns are better than coaching by feel.
Track Shots with One Tap
Handball Stats records shot location on an interactive court. Build your data set effortlessly.
Get Started Free